 This might explain the reason why the Panic. the above graph of the DOW current average (2003-2008) is super-imposed over the graph of the graph from 1925 to 1931.
If you want to cry through your tears I have a cartoon for you.

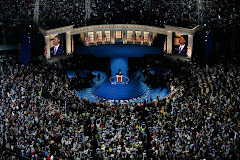
Candidate Obama at UCCS, July 2009; I am seated just behind the President's right shoulder.
This might explain the reason why the Panic. the above graph of the DOW current average (2003-2008) is super-imposed over the graph of the graph from 1925 to 1931.


No comments:
Post a Comment